
When you ask someone to rate a service, a class, or even a product, you often give them a set of options to choose from. That is where rating scales come in. They help you turn opinions into something measurable.
In this blog, we are going to take a look at what a 5 point rating scale is, how it works, and how you can use it properly in surveys or feedback forms.
What is a 5 Point Rating Scale?
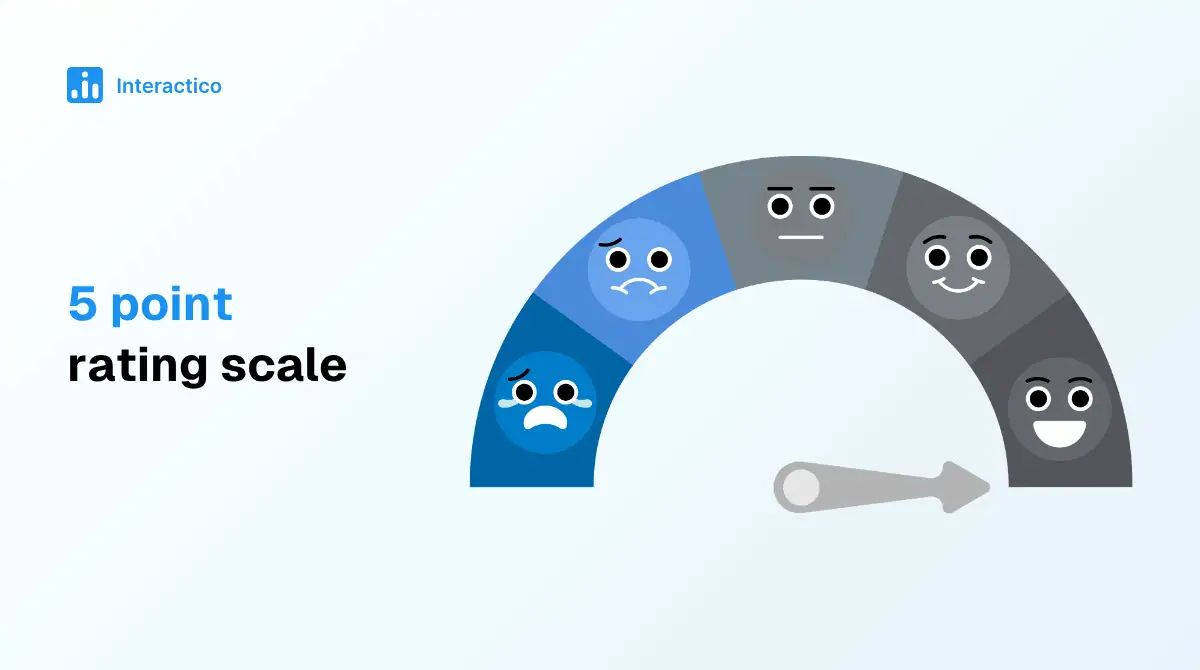
A 5 point rating scale is a response system where people choose one option from five ordered choices to show how they feel about something. These choices are arranged in a sequence, usually moving from a negative end to a positive end, with a middle option that sits between the two.
What makes this scale useful is not just the number of options, but the structure behind it. Each point represents a level of intensity. Instead of just saying “yes” or “no,” the respondent can show how strong their opinion is.
For example, if you ask someone about their experience, a simple answer like “good” does not tell you much. But if they select “4 out of 5,” it gives you a clearer sense that the experience was positive, but not perfect. That extra layer of detail is what makes this scale practical.
Another reason this format is widely used is because it is easy to understand. Most people do not need instructions to answer it. At the same time, it still gives enough variation in responses to make the data useful for analysis.
5-Point Scale Examples
A 5 point scale can be adapted based on what you are trying to measure. The wording changes, but the structure remains the same. Here are some common formats you will come across.
1. Satisfaction
Used when you want to understand how someone feels after an experience. This is common in customer feedback and service reviews.
Typical scale:
- Very dissatisfied
- Dissatisfied
- Neutral
- Satisfied
- Very satisfied
Where it works well:
- Product feedback
- Event reviews
- Course or training evaluation
What it tells you:
It shows emotional response. Not just whether someone liked something, but how strongly they felt about it.
2. Agreement
Built around statements rather than direct questions. Respondents react to a sentence instead of answering a question.
Typical scale:
- Strongly disagree
- Disagree
- Neutral
- Agree
- Strongly agree
Where it works well:
- Research surveys
- Opinion studies
- Feedback on usability or clarity
What it tells you:
It helps you understand beliefs and attitudes. You can also measure how strongly people lean toward a certain view.
3. Performance
Used when evaluating how well something or someone is doing.
Typical scale:
- Very poor
- Poor
- Average
- Good
- Excellent
Where it works well:
- Employee reviews
- Student assessments
- Project evaluations
What it tells you:
It connects responses to expectations. You can quickly see if something is below, meeting, or exceeding standards.
4. Frequency
Focuses on how often something happens, not how someone feels about it.
Typical scale:
- Never
- Rarely
- Sometimes
- Often
- Always
Where it works well:
- Behaviour tracking
- App usage studies
- Habit-based surveys
What it tells you:
It highlights patterns over time. Instead of opinion, you get insight into behaviour.
5. Quality
Used to judge the standard of something, often from a slightly more objective angle.
Typical scale:
- Very poor
- Poor
- Fair
- Good
- Excellent
Where it works well:
- Product reviews
- Content evaluation
- Service audits
What it tells you:
It helps separate emotional satisfaction from actual quality perception.
Key Aspects of the 5-Point Scale
While the format looks straightforward, how you design and interpret it can affect the quality of your data. Here are a few important aspects to keep in mind.
1. Interpretation
Interpretation is about how different people understand and use each option on the scale. Even though the labels look clear, not everyone reads them the same way.
For example, one person might see “4 = Good” as a strong positive rating, while someone else may only choose “5 = Excellent” when they are truly satisfied and use “4” for something average. Both are using the scale differently, even though the labels are the same.
This difference becomes a problem when you try to analyse results. Two people may feel the same way but choose different ratings because their internal standards are not aligned.
To reduce this confusion, your scale labels should be:
- Clearly spaced in meaning, so each option feels distinct
- Consistent across all questions
- Easy to understand without overthinking
In some cases, adding short descriptions can help. For example:
- 1 = Very poor (did not meet expectations)
- 3 = Average (met basic expectations)
- 5 = Excellent (exceeded expectations)
This gives respondents a clearer reference point and makes the data more reliable.
2. Midpoint Usage
The midpoint is the third option on a 5-point scale. It is usually labelled as “Neutral,” “Neither agree nor disagree,” or something similar. On paper, it gives people a balanced option when they don’t lean positive or negative.
But in practice, people use the midpoint for different reasons. Some genuinely feel neutral. Others pick it when they are unsure, don’t want to think too much, or don’t feel strongly enough to choose a side.
This creates a small challenge when you look at the data. A neutral response does not always mean the same thing. It could mean indifference, confusion, or even hesitation.
So when should you include it?
- Keep the midpoint if you want to capture honest neutrality or mixed opinions
- Avoid it if you want respondents to take a clear stand
If you do include it, make sure the label is clear. “Neutral” works better than vague options like “Okay” or “Fine,” which people may interpret differently.
3. Effectiveness
The 5 point scale works well because it strikes a balance. It is detailed enough to capture differences in opinion but simple enough for people to respond quickly.
If you use too many options, respondents may feel overwhelmed. If you use too few, you may miss out on useful insights. The 5 point structure avoids both extremes, which is why it is commonly preferred.
Best Practices
Even though the format is simple, the quality of your survey depends on how well you design it. Here are some practical tips you can follow.
1. Formulate Clear, Concise Questions
Your questions should be easy to read and understand at first glance. Avoid long sentences or technical language.
For example, instead of asking, “How would you evaluate the overall efficiency of the service delivery mechanism?” you can ask, “How satisfied are you with the service?”
Clarity reduces confusion and improves the accuracy of responses.
2. Refrain from Leading Questions
A leading question pushes the respondent towards a particular answer. This can distort your results.
For example, “How great was your experience with our service?” already suggests a positive answer. A better version would be, “How would you rate your experience with our service?”
Keep your questions neutral so that responses reflect actual opinions.
3. Pre-test Your Survey
Before sharing your survey widely, test it with a small group. This helps you identify unclear questions, confusing scales, or technical issues.
You might notice that some questions are being skipped or misunderstood. Fixing these early saves you from collecting poor-quality data later.
Closing Thoughts
A 5-point rating scale may look simple, but it plays an important role in how you collect and understand feedback. It gives people enough room to express their views without making the process complicated.
Whether you are running a survey, collecting classroom feedback, or evaluating performance, this scale offers a practical and familiar format. The real difference comes from how thoughtfully you design your questions and interpret the responses.
If used carefully, a 5-point scale can give you insights that are both clear and useful.
FAQs:
Why is 5 points considered the ideal number of options?
Five options offer a balanced structure. They give enough variation to capture different
opinions while keeping the scale simple to use. Respondents can quickly choose an option
without overthinking, which improves response rates and consistency.
What is the neutral midpoint in a 5-point scale, and should it be included?
The neutral midpoint is the third option in the scale. It represents a middle ground where
the respondent does not lean strongly towards either side.
Including it depends on your goal. If you want to allow neutral opinions, keep them. If you want
Respondents to take a clear stand, you may choose to remove it.
What are the limitations of a 5-point rating scale?
One limitation is that responses can be subjective. Different people may interpret the same
option differently. Another issue is central tendency, where respondents choose the middle
option to avoid making a decision.
Also, a 5 point scale may not capture very fine differences in opinion. In such cases, a larger
scale might be more suitable.