
Choosing the right type of survey scale improves response quality, clarity, and decision-making.If your survey questions are good but your data still feels confusing, the problem is often the scale and not the question. Understanding the different types of scales used for surveys helps you design better questionnaires, improve response quality, and make smarter decisions.
What Is a Survey Scale?
A survey scale is a structured way to measure responses by assigning values, categories, or ranges to opinions, behaviors, or perceptions. So, instead of asking vague questions, it helps convert responses into data that can be easily analyzed.
For example, instead of asking “Did you like the session?”, a scale allows you to measure how much someone liked it.
What Are the 4 Fundamental Levels of Measurement?
The four fundamental levels of measurement: nominal scale, ordinal scale, interval scale, and ratio scale, define how data is categorized, ordered, and analyzed in a survey. They form the foundation for choosing the right types of survey scales, because every scale you use is built on one of these measurement levels.
1. Nominal Scale
A nominal scale is used to classify data into distinct categories without any order or ranking between them. Each category is simply labeled, and there is no logical sequence or measurable difference between the options.
Best for: Grouping responses such as demographics, preferences, or classifications where order does not matter.
Example:
“What is your preferred learning mode?”
- Online
- Offline
- Hybrid
2. Ordinal Scale
This fundamental level of measurement organizes data into a meaningful order or ranking, but the differences between each level are not equal or measurable. While you can identify which option is higher or lower, you cannot determine how much higher or lower it is.
Best for: Measuring satisfaction levels, preferences, or rankings where relative position matters more than exact differences.
Example:
“How satisfied are you with the training?”
- Very satisfied
- Satisfied
- Neutral
- Dissatisfied
3. Interval Scale
An interval scale measures data with equal intervals between values, which allows you to compare differences accurately.
Best for: When you need to measure and compare differences in responses, such as ratings, scores, or temperature.
Example:
“Rate your experience from 1 to 10.”
4. Ratio Scale
This level of measurement includes all the properties of an interval scale but also has a true zero point, which represents the complete absence of a value. It allows for meaningful comparisons, including ratios and percentages.
Best for: Measuring quantities such as time, frequency, or counts where exact values and comparisons are important.
Example:
“How many hours did you spend learning this week?”
What Are the Different Types of Survey Scales?
1. Likert Scale
A Likert scale is a structured scale that measures the level of agreement or disagreement with a given statement. It captures attitudes and opinions by offering a balanced range of response options, usually on a 5-point or 7-point scale.
Best for: Measuring opinions, attitudes, and perceptions in surveys, feedback forms, and evaluations.
Example:
“I found this training useful.”
- Strongly agree
- Agree
- Neutral
- Disagree
- Strongly disagree
2. Semantic Differential Scale
A semantic differential scale measures how people perceive a concept by asking them to rate it between two opposite adjectives. This approach helps capture emotional responses and subtle differences in perception.
Best for: Understanding feelings, attitudes, and brand or experience perception in a more nuanced way.
Example:
Easy 1 — 2 — 3 — 4 — 5 Difficult
Read More About the Semantic Differential Scale
3. Rating Scale
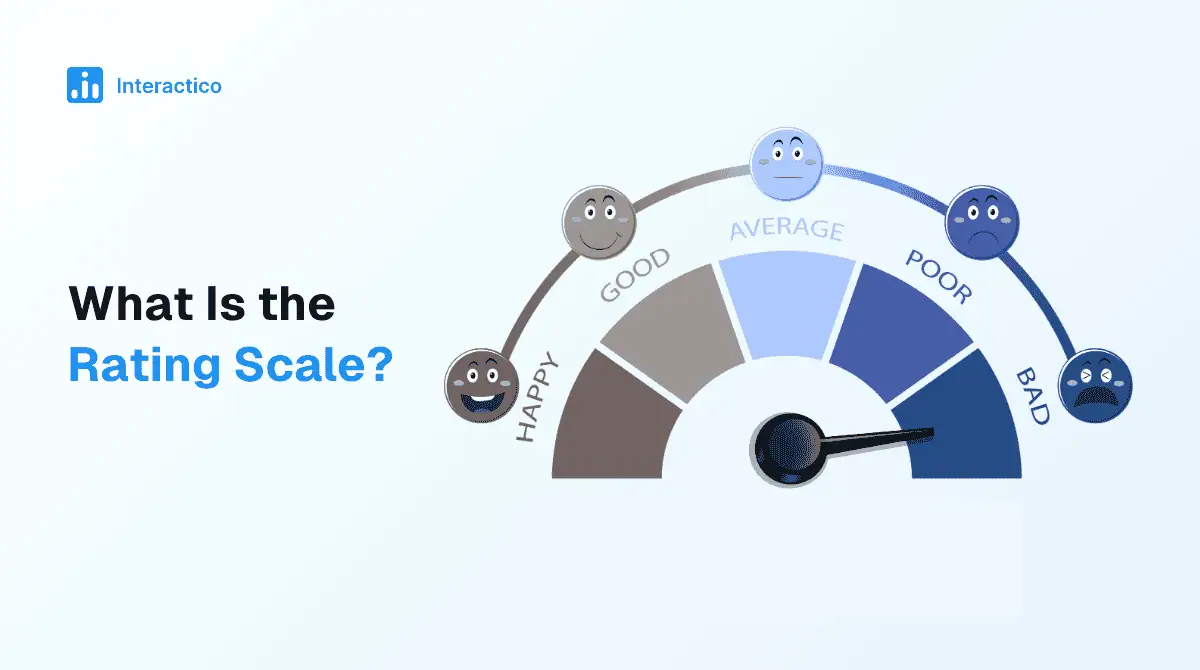
This type of survey scale allows respondents to evaluate something based on a numeric or descriptive range. It provides a flexible way to measure intensity, quality, or performance across different contexts.
Best for: Assessing satisfaction, performance, quality, or overall experience in a simple and scalable format.
Example:
“Rate your experience from 1 to 10.”
Sub-types:
- Numeric Scale: A numeric scale uses numbers to represent levels of intensity, such as 1 to 5 or 1 to 10.
- Descriptive Scale: A descriptive scale uses words instead of numbers to describe levels, such as poor, average, or excellent.
- Graphical Scale: A graphical scale uses visual elements like sliders or bars to represent responses.
4. Dichotomous Scale
A dichotomous scale provides only two possible response options, making it the simplest type of survey scale. It forces a clear choice without allowing any middle ground or neutral response.
Best for: Straightforward questions where a clear yes or no answer is sufficient.
Example:
“Did you complete the course?”
- Yes
- No
5. Rank Order Scale
A rank order scale is a type of survey scale that requires respondents to arrange options in order of preference or importance. It helps identify priorities by forcing users to compare choices directly.
Best for: Understanding preferences, priorities, or decision-making factors.
Example:
“Rank these factors in order of importance:”
- Price
- Quality
- Convenience
6. Guttman Scale
A Guttman scale is a cumulative scale where agreement with one statement implies agreement with less intense statements. It is designed to measure the progression or strength of a belief or attitude.
Best for: Measuring intensity, progression, or levels of commitment in attitudes and behaviors.
Example:
“I would try this product” → “I would recommend it” → “I would pay for it”
7. Net Promoter Score (NPS) Scale
The Net Promoter Score (NPS) scale measures customer loyalty by asking how likely someone is to recommend a product or service. It categorizes respondents into promoters, passives, and detractors based on their score.
Best for: Tracking customer satisfaction, loyalty, and overall brand perception.
Example:
“How likely are you to recommend us?”
Scale: 0 (Not likely) to 10 (Highly likely)
8. Continuous/Visual Analog Scale (VAS)
This type of survey scale allows respondents to select any point along a continuous line between two extremes. This provides more precise data compared to fixed-point scales.
Best for: Capturing subtle differences in perception or intensity.
Example:
Not satisfied ─────────────── Very satisfied
9. Frequency Scale
A frequency scale measures how often a behavior, action, or experience occurs over time. It helps quantify patterns and habits in a structured way.
Best for: Tracking behaviors, usage patterns, or recurring actions.
Example:
“How often do you use this tool?”
- Always
- Often
- Sometimes
- Rarely
- Never
How to Choose the Right Type of Scale in Surveying
-
Focus on Your Research Objective
The first step to choosing the right type of survey scale for your survey is to identify the research objective. Choose a scale based on what you want to measure, because different goals (like satisfaction, behavior, or opinion) require different survey scales.
-
Consider Your Audience
Select a scale that your audience can easily understand and respond to, since overly complex scales can reduce response quality and accuracy.
-
Balance Precision & Simplicity
Lastly, use a type of survey scale that provides enough detail for analysis while still being simple enough for respondents to answer quickly without confusion.
Tips to Use Survey Scales Types More Effectively
- Test your scales: Always test your survey scale types before launching to identify confusion, bias, or unclear wording. This ensures that respondents interpret the scale correctly and provide accurate answers.
- Standardize scale order: Keep the order of your scales consistent throughout the survey to avoid confusing respondents. Changing the direction or format can lead to inconsistent and unreliable data.
- Keep scale points consistent: Use the same number of scale points across similar questions to maintain uniformity. This improves data comparison and makes analysis more reliable.
- Label options clearly: Clearly define each scale point so respondents understand what each option represents. Ambiguous labels can lead to misinterpretation and poor-quality responses.
- Ensure accessibility: Design your scales so they are easy to read and use across all devices and for all users. Accessible surveys improve participation rates and ensure inclusive data collection.
Design smarter surveys and engage your audience effortlessly with Interactico.

FAQs:
How many points should a survey scale have?
A 5-point scale works well for most surveys because it balances simplicity and accuracy. But if you want more detailed answers for advanced research, then a 7-point scale is better.
Which type of survey scale is best for customer satisfaction?
A Likert scale or a 1-10 rating scale works well for satisfaction, while NPS is best for measuring customer loyalty.
What is the 4-point scale in surveys?
A 4-point scale removes the neutral option, forcing respondents to choose a positive or negative stance, which helps gather more decisive feedback.
What is the difference between a Likert scale and a rating scale?
A Likert scale specifically measures agreement with statements, while a rating scale is a broader format that includes numeric or descriptive scoring systems.